Upper Air
- Current 300 mb Contours and Wind
- Mean 500 mb Heights and Wind Vectors
- 500 mb Vertical Velocity (Omega)
- Jet Stream

A U-shape pattern is called a trough. On the east side of troughs, storms tend to strengthen.
500 mb heights show the pattern of upper-level pressure. Upper-level wind vectors show direction and speed by the orientation and length of vector. January and July 500 mb height animations show the general flow of air in the upper atmosphere. The average altitude of 500 mb is ~20,000 feet.
Question: What is the common wind direction in Central Africa? Compare this wind direction with the United States.
500 mb vertical velocity (Omega) indicate areas of large-scale rising (blue) and sinking (orange) motion. Rising air (blue) often indicates regions of low pressure. Low pressure results in rising air, and often precipitation. Sinking air (orange) often indicates regions of high pressure. High pressure results in sinking air, and often dry weather.
Questions:
- Find SE Asia. Can you see the ITCZ (equatorial low pressure) that migrates with the seasons?
- Does the air usually rise or sink over Northern Africa?
The jet stream is a current of fast moving air found in the upper levels of the atmosphere. This rapid current is typically thousands of kilometers long, a few hundred kilometers wide, and only a few kilometers thick. Jet streams are usually found somewhere between 10-15 km (6-9 miles) above the earth's surface. The position of this upper-level jet stream denotes the location of the strongest SURFACE temperature contrast.
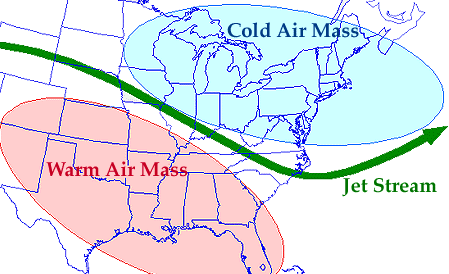
During the winter months, Arctic and tropical air masses create a stronger surface temperature contrast resulting in a strong jet stream. However, during the summer months, when the surface temperature variation is less dramatic, the winds of the jet are weaker.