Cardiology
QRS NOMENCLATURE
- WAVE
A wave is a graphic representation of an electrical event. A wave always has two components (not always seen), an upstroke and a downstroke or visa versa. A wave usually begins and ends on the baseline. A wave is never described as elevated or depressed. - SEGMENT
A segment is an electrically quiet area in the EKG cycle. There are three segments: TP, PR, ST. The PR and ST segments are always measured against the TP segment. They would be described as Isoelectric (on the baseline) elevated or depressed with respect to the TP. The unit of measurement is in millimeters
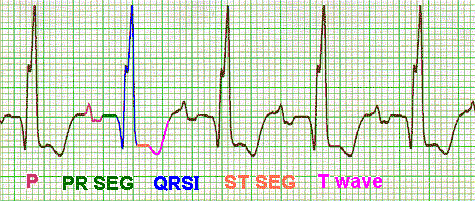
- P - WAVE
The P wave is the first wave of the normal cardiac cycle. It represents atrial depolarization. When it has originated from the SA node, it is usually 2 mms by 2 mms and is nicely rounded in contour. It is normally upright in leads I, II, III, V2-6. - PR SEGMENT
This is the flat area of baseline following the P wave and ends at the start of ventricular depolarization.
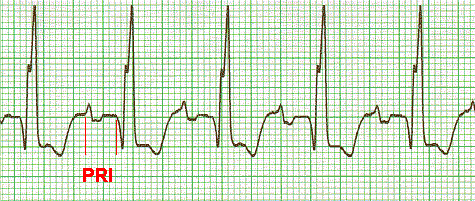
- PR INTERVAL
This is the measurement of the beginning of the P wave to the beginning of the q wave or if the q is absent, the beginning of the R. This measurement is useful in determining AV Heartblocks. Normal adult values are 0.12 to 0.2 sec.
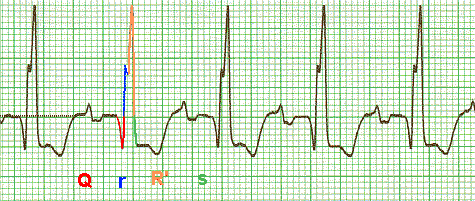
- q WAVES
Also called small q, septal q, or insignificant q. If present, is the first negative wave of ventricular depolarization and always precedes the r or s waves if they are present. It represents septal L to R depolarization. There can only be one q to each QRS complex. It is never normally greater than 1/3 the total height of the QRS complex and/or greater than 0.03 seconds in duration. It is usually seen best in leads I, aVL, II, V5-6. - Q WAVES
Also called significant Qs or pathological Qs. They are the same as above except they are greater than 1/3 the height of the QRS and/or exceed 0.03 seconds in duration. When observed in multiple adjacent leads, they suggest necrotic tissue of a myocardial infarction (age unknown). - R WAVE
An R wave, if present, is always positive and occurs after the q wave if a q was present. In lead II the R wave represents the bulk of LV depolarization. In lead V1 it represents septal depolarization. - S WAVE
An S wave, if present, follows the R wave, if an R was present, and is always a negative wave. In lead II it represents late depolarization of part of the RV. - R' WAVE
If the ventricular depolarization continues, any positive wave above the baseline would be called an R' (R prime) - S' WAVE
If the ventricular depolarization continues, any negative wave below the baseline would be called an S' (S prime)
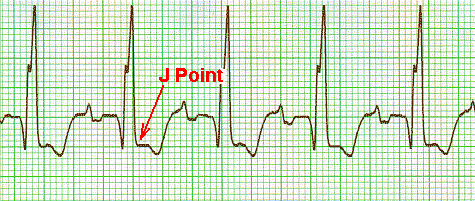
- J POINT
The J point is an essential landmark for measuring QRS duration. The J point is at the end of Ventricular depolarization and at times can be hard to find. Occasionally the only hint of the J point is a slurring of the pen. QRS waves are very vertical while the ST segment is usually very horizontal. Because the J point is the intersection of these waves, you will be looking for the change from vertical to more horizontal. Practice finding J points
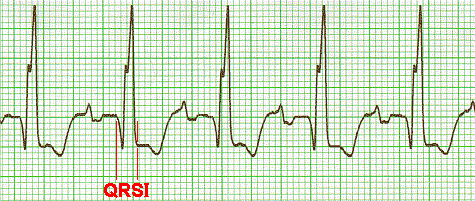
- QRS INTERVAL
The QRS interval is the measure of time from the beginning of the Q wave to the J point. The normal duration of this measurement is 0.06 - 0.11 seconds in the normal adult heart. This measurement is useful in diagnosing BBB or primary ventricular activation. - ST SEGMENT
This is the electrically quiet area after the J point and usually lasts 0.08 - 0.12 seconds. It is normally on the baseline and when elevated above the baseline in a group of adjacent leads, can be used to diagnose acute myocardial injury. The ST segment, as it relates to the isoelectric line, is measured at a point 0.08 seconds past the J point. - T WAVE
The T wave represents ventricular repolarization. The T wave is a nicely rounded wave that follows the ST segment and in the normal heart, follows the direction of the main QRS deflection. The usual T wave is never normally taller than half the height of the total QRS height. Terms used to describe abnormal T waves would be: tall, flattened, pointed, pinched, notched, broad, inverted, deeply inverted, flat. It should never be described as absent, elevated or depressed. - U WAVE
The U wave is a medical curiosity. It is not clear what relationship it has with cardiac activity. We do know that it becomes taller in hypokalemia and can flip in CAD. It usually follows the direction of the T wave and is best seen in lead V3.
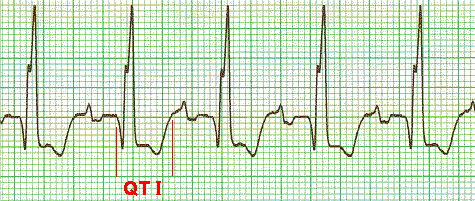
- QT INTERVAL
This interval is measured from the beginning of the QRS to the end of the T wave. At heart rates of 65-90 the QT should not exceed half the R to R interval. This measurement is useful when dealing with calcium imbalance and TDP. How to Measure the QT and QTc. - TP SEGMENT
This is the baseline between the T wave and the p wave. It is also known as the isoelectric line. The baseline is drawn by using the terminal TP segment to terminal TP segment.