Radar & Satellite
- National Radar Map
- Sample Station Plot
- Pressure Trend Symbols
- Sky Cover Symbols
- Northeast Radar Map (Loop)
- Water Vapor
This map shows areas with precipitation. Precipitation may be rain, snow, sleet, or hail. Green colors represent light precipitation, whereas orange and red colors indicate heavier precipitation.
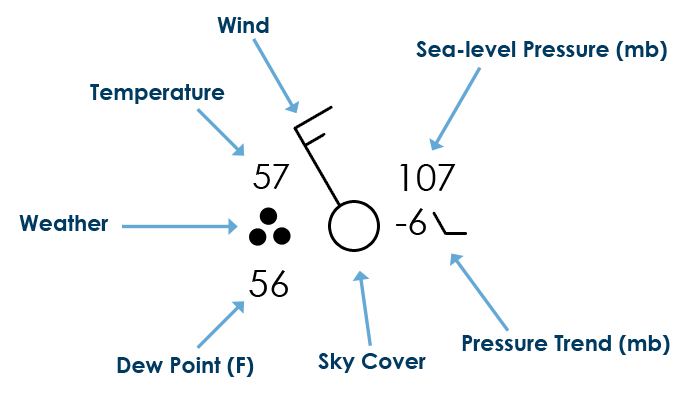
Reading a Station Plot
Z refers to Zulu time, or Coordinated Universal Time (UTC), based on the prime meridian that runs through Greenwich, England. 13 Z refers to 1 pm in England. However, in Rochester, 13Z means that it is 9 am (Daylight Savings Time) or 8 am when we are not practicing daylight savings time (early Nov through early March).
Wind is plotted in increments of 5 knots (kts), with the outer end of the symbol pointing toward the direction from which the wind is blowing. The wind speed is determined by adding up the total of flags, lines, and half-lines, each of which have the following individual values:
Flag: 50 kts
Line: 10 kts
Half-Line: 5 kts
If there is only a circle depicted over the station with no wind symbol present, the wind is calm.
Sea-level pressure is plotted in tenths of millibars (mb), with the leading 10 or 9 omitted. For reference, 1013 mb is equivalent to 29.92 inches of mercury. Below are some sample conversions between plotted and complete sea-level pressure values:
410: 1041.0 mb
103: 1010.3 mb
987: 998.7 mb
872: 987.2 mb
Back to top
The pressure trend has two components, a number and symbol, to indicate how the sea-level pressure has changed during the past three hours. The number provides the 3-hour change in tenths of millibars, while the symbol provides a graphic illustration of how this change occurred.
Back to top
The amount that the circle at the center of the station plot is filled in reflects the approximate amount that the sky is covered with clouds.
Back to top
Precipitation may be rain, snow, sleet, or hail.
What do the colors mean in the reflectivity images?
The colors are the different values of energy that are reflected back toward the radar. Called echoes, the reflected intensities are measured in dBZ (decibels of z). As the strength of the signal returned to the radar increases the dBZ values increases. The Doppler radar does not determine where rain is located, only areas of returned energy.
The "dB" in the dBz scale is logarithmic and has no numerical value, but is used only to express a ratio. The "z" is the ratio of the density of water drops (measured in millimeters, raised to the 6th power) in each cubic meter (mm^6/m^3). Mathematically:
dBz= 10 * log (z/z0) Where z = reflectivity factor and Z0 is defined to be 1 mm^6/m^3
When the "z" is large (many drops in a cubic meter), the reflected power is large. A small "z" means little returned energy. In fact, "z" can be less than 1 mm^6/m^3 and since it is logarithmic, dBz values will become negative, as often in the case when the radar is in clear air mode and indicated by earthtone colors.
The scale of dBZ values is also related to the intensity of rainfall. Typically, light rain is occurring when the dBZ value reaches 20. The higher the dBZ, the stronger the rainrate.
Back to top
In this imagery, bright blue and white areas indicate the presence of high water vapor or moisture content, whereas dark orange and brown areas indicate little or no moisture present.
Back to top