Spring 2021 Inside IR
Inside This Issue
SUNY Online at MCC
By William Dixon
SUNY Online is projected to grow to 1,000 students per program at the state level, helping MCC not only stabilize enrollment but increase enrollment in certain programs.
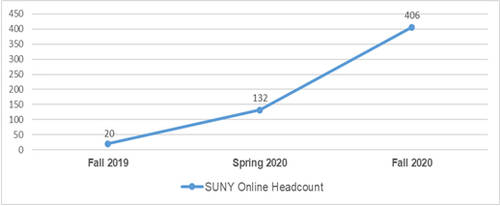
MCC was selected by SUNY to offer three SUNY online programs, the first of which began in Fall 2019. Over the past three semesters, MCC has seen substantial growth in the SUNY online population in term of headcount and the number ofcredits generated at MCC. (See Figure 1.)
SUNY Online is projected to grow to 1,000 students per program at the state level, helping MCC not only stabilize enrollment but increase enrollment in certain programs. Table 1 below outlines the number of credit hours generated by SUNY Online students.
Figure 1 For SUNY Online at MCC
Figure 1: SUNY Online Student Enrollment

Table 1 For SUNY Online at MCC
| SUNY Online Enrollment | Fall 2019 | Spring 2020 | Fall 2020 |
|---|---|---|---|
| Course Enrollments (1) | 80 | 469 | 1467 |
| Credit Hours Generated (2) | 115 | 1374 | 4595 |
| FTE Produced (3) | 3.8 | 45.8 | 153.2 |
(1) Course Enrollments equals the total number of courses SUNY online students registered for.
(2) Credit hours generated equals the total number of credit hours generated by SUNY online students.
(3) FTE produced is generated by taking the total number of credit hours generated and dividing by 30.
Fall to Spring Persistence 2020-2021
By Elina Belyablya
There was a similar enrollment decline trend among community colleges across SUNY and the nation.
The overall persistence from fall 2020 to spring 2021 decreased five percentage points compared to the prior spring and went below 70% for the first time in College history. The decreases were especially steep for new students. First-time students’ persistence decreased 9.9 percentage points and transfer ones went down 9.0 percentage points (See Table 2). The decrease of returning and continuing was about three percentage points.
The rhetoric of enrollment and persistence became more critical during the College pandemic life cycle, as spring enrollment continued the downward trend with reduction of 22.8% in FTEs and 19.5% in headcount from last spring. The reduction in spring 2021 enrollment was due to summative effects of COVID-19 Pandemic on the College enrollment: fall 2020 enrollment decline of 12.2% in headcount from prior fall and spring 2021 persistence drop of 5 percentage points.
Similar enrollment decline trend for Community Colleges was confirmed within SUNY (-12.7%) and nationally. At the same time, SUNY four-year colleges and universities did not experience as much volatility (-1.8%) as two-year sector. The reasons for that difference would likely point to the long existing academic risk, equity and vulnerability factors of the serving population. To that affect we can witness lower volatility in some groups within our own institution.
The silver lining is in lower persistence volatility for the continuing students, the ones that had some pre-pandemic MCC experience as well as resilience of continuing.
Thus, white females’ persistence to spring remained flat. (See Table 3.)
For more information, read Spring Enrollments Continue Downward Trend.
Figure 2 for Fall to Spring Persistence 2020-2021
Figure 2: Fall to Spring Persistence by Student Type (among degree-seeking non-grads)


Table 2 for Fall to Spring Persistence 2020-2021
| Fall Term | Fall 2014 | Fall 2015 | Fall 2016 | Fall 2017 | Fall 2018 | Fall 2019 | Fall 2020 |
|---|---|---|---|---|---|---|---|
| Persistance Rate | 77.3% | 76.0% | 75.4% | 75.1% | 74.5% | 73.8% | 68.8% |
Table 3 for Fall to Spring Persistence 2020-2021
| Gender | Fall 2017 | Fall 2018 | Fall 2019 | Fall 2020 |
|---|---|---|---|---|
| Male | 74.5% | 73.3% | 72.0% | 56.5% |
| Female | 79.6% | 75.0% | 77.6% | 63.9% |
| Gender | Fall 2017 | Fall 2018 | Fall 2019 | Fall 2020 |
|---|---|---|---|---|
| Male | 79.6% | 75.3% | 78.5% | 69.8% |
| Female | 83.3% | 80.5% | 79.6% | 75.4% |
| Gender | Fall 2017 | Fall 2018 | Fall 2019 | Fall 2020 |
|---|---|---|---|---|
| Male | 73.1% | 72.2% | 73.3% | 69.4% |
| Female | 75.5% | 75.0% | 70.4% | 68.3% |
| Gender | Fall 2017 | Fall 2018 | Fall 2019 | Fall 2020 |
|---|---|---|---|---|
| Male | 76.7% | 80.8% | 79.9% | 74.7% |
| Female | 79.0% | 77.9% | 77.8% | 76.8% |
Top Initiatives that Impact Persistence
By William Dixon
Practices that have a significant impact on student persistence include:
- awarding financial aid
- having students attend learning center appointments
- meeting with their advisor.
Beginning in Fall 2017, MCC has used the CIVITAS Impact tool to identify what impact initiatives have had on student persistence. These “Impact” reports compare students who participated in the initiative to students who look almost identical to them in terms of persistence scores but did not participate. This creates one of the strongest research designs in statistics, called a quasi-experimental design, and has been used in peer-reviewed research many times.
Analysis of MCC’s top initiatives indicate common practices that have a significant impact on student persistence and could be used for future resource allocation. The practices include; awarding financial aid to students, having students attend learning center appointments, and meeting with their advisor. Conversations with CIVITAS confirm that these practices have had lifts in persistence for almost every school that has measured them. Our results show the overall lift in persistence but each initiative may impact certain populations more than others. A complete Impact report is available for each initiative listed here and can be requested from the IR office.
Table 4 for Top Initiatives that Impact Persistence
| Initiative Lift in Persistence | Lift in Persistence |
|---|---|
| Student Support Services (SSS) | 17.8% |
| CARES Act Funding | 17.2% |
| CircleIn | 13.5% |
| Spring 2020 Students Receiving EOP | 11.5% |
| Received APTS funding – Part Time Students | 9.5% |
| Scheduled and Attended 2 or More Advising Sessions | 9.2% |
| Received a Starfish Kudo | 9.0% |
| Attended the Academic Foundations Learning Center | 8.9% |
MCC Digital Access Survey Results
By Mary Ann M. DeMario
Windows 10 is the operating system students need to best access MCC platforms.
In December 2020, a link to MCC’s Digital Access Survey was emailed to 11,173 students. We received a 6.1% response rate, which gives us a margin of error of ±5%. This means that the results can be generalized to the fall student population.
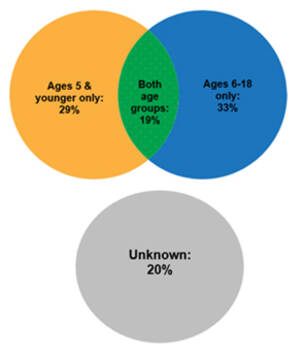
For Student-Parents, access to technology is critical for their school-age kids as well as themselves. As shown in Figure 3, 52% of Student-Parents have school-age kids. But that may be as high as 72% due to the unknown age groups.
The key findings are that:
- 96% of students owned a device they could use to access their coursework remotely. However, Pell-eligible students, students of color, and Single Mom Learners had lower levels (94%, 93%, and 88%, respectively) of access to devices.
- 59% of students had access to a PC with Windows 10, and nearly half of students owned a smart phone.
- 88% had reliable high-speed internet access at home. Pell-eligible students and students placed in TRS courses were less likely (82% and 79%, respectively) to have it.
- 59% of students without a device reported being able to come to campus to use MCC technology and Internet. The subgroups who were less likely to do so were Pell-eligible, female, and Student-Parents (52%, 55%, and 45%, respectively).
- 60% of students without a device reported being able to come to campus to take a proctored exam. The subgroups who were less likely to be able to do so were Pell-eligible and Student-Parents, most noticeably Single Mom Learners (56%, 50%, and 44%, respectively).
- One-third of students had problems accessing the programs and applications they needed for school, such as Blackboard and Zoom. More full-timers than part-timers (34% vs. 26%) had problems.
- Only 15% of students said their access to technology negatively impacted their schoolwork. The groups more likely to report a negative impact were males, first-time and continuing students, and students who were college ready in math (17%, 17%, 18%, and 19%, respectively).
- 91% of students had a webcam, but fewer part-timers (86%) had one.
Students’ typed-in comments shed additional light on technology issues. For example, among students who don’t have Internet access at home, the most common way they access the Internet is by creating a hot spot using their smart phone. Students also reported frequent problems with Blackboard and Zoom.
Figure 3 for MCC Digital Access Survey Results
Figure 3: Age Groups of Student-Parents’ Children

Additional Information & Contacts
For more information, you can visit the Institutional Research (IR) website or contact an IR staff member:
- William Dixon, Director, (585) 292-3031
- Elina Belyablya, Assistant Director, (585) 292-3033
- Mary Ann Matta DeMario, Specialist, (585) 292-3032
- Allison Wanek, Clerk, (585) 292-3035
Previous issues of Inside IR are available through our Newsletters webpage.

