Fall 2021 Inside IR
Inside This Issue
Outcomes of CARES Act I Funding
By William Dixon
In spring 2020, $3,505,040 was given out to MCC students as part of the first wave of federal CARES Act funding. This funding was awarded to 4,326 degree-seeking students who demonstrated a financial need, defined as either: (1) receiving Pell Grant funding, or (2) applying for Pell, but deemed ineligible.
Figure 1 outlines what has happened since receiving the first round of CARES Act funding. In essence, the first semester showed the largest increase in persistence. This increase has continued into Fall 2021.
In terms of overall success, 55% of the students who were awarded funding are still enrolled at MCC or have graduated, compared to 48% of students who were not awarded funding.
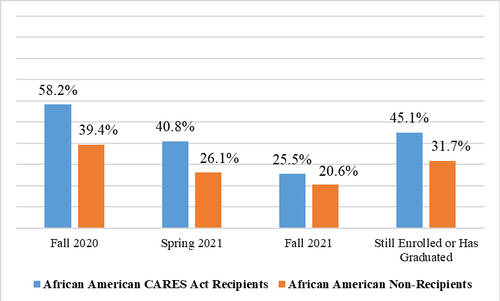
Among students of color, the difference between recipients and non-recipients is more striking. Figure 2 shows the results just for African American students.
Figure 1 for Outcomes of CARES Act I Funding
Figure 1: Persistence, Retention, and Long Term Outcomes Based on Receipt of CARES Act Funds

Figure 2 for Outcomes of CARES Act I Funding
Figure 2: Persistence, Retention, and Long Term Outcomes Based on Receipt of CARES Act Funds: African American Students Only
Got Data? The IR Web Pages May Have What You Need
By Mary Ann M. DeMario
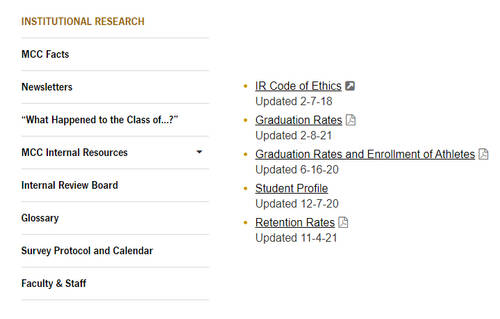
The IR Office works year-round to ensure the College community has access to the most up-to-date information. Before submitting a research request or contacting IR, please see if the data you want is on online. There are two main sections:
- Public-facing - on our Institutional Research home page (shown in Figure 3)
- Secure – accessible by clicking on “MCC Internal Resources” on the landing page, then logging in with MCC credentials.
The secure page, in contrast, contains the following, more detailed information:
- Learning Center Guidelines & Referral Instructions
- Tableau Reports
- SUNY Excels Dashboard
- Town Hall Spring 2019 (Current Priorities in Academic Services and the Use of Data)
- Enrollment
- Highlights
- Student Demographics
- History
- Fall Headcount Trends, Student Type
- Budget and Forecast
- Comparison Enrollment Reports
- Key Performance indicators
- Academics
- Department
- Program
- Student Outcomes
- Site Profiles
- Market Share
- Geographic
- Civitas Impact Results
- Finances & Human Resources
- Overall Cost per FTE
- Ethnic Distribution
- Operating Expenditures
- Surveys
- 2017 Gallup Poll
- SUNY Student Opinion Survey
- New Student Expectations & Experiences Surveys
- MCC Faculty-Staff Surveys
- Student Satisfaction
- Community College Survey of Student Engagement
- Community College Faculty
- Survey of Student Engagement
- COVID Era College-Wide Survey
The Institutional Research Office supports all segments of the College community with information for planning, policy analysis, assessment, and decision making. The major functions of the office are to collect, analyze, and interpret data and to present research findings to administrators, faculty, and staff to use for advancement of the College mission.
Figure 3 for Got Data? The IR Web Pages May Have What You Need
Figure 3: Public-Facing IR Data
Summer 2021 Enrollment Highlights
By Elina Belyablya
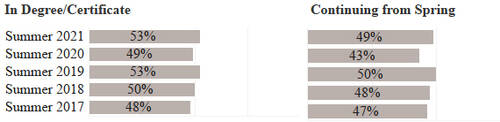
In summer 2021, MCC enrollment was 4,817 students, or 773.7 FTEs. This was a decrease of 9.4% students and 11.6% in FTEs since last summer, but it was 4.4% above the budget target. PSTF enrollment was up 32.1 FTEs from last summer. The total 2020-21 credit enrollment was 7.1% below the budget due to decreased enrollment at all sites from the prior year.
Figure 4 illustrates changes in summer enrollment over time. Figure 5 and Figure 6 illustrate summer 2021 enrollment by demographic characteristics and academic characteristics, respectively.
Figure 4 for Summer 2021 Enrollment Highlights
Figure 4: Changes in Summer Enrollment: Headcount and FTEs
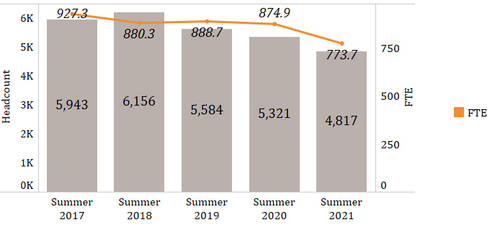
Figure 5 for Summer 2021 Enrollment Highlights
Figure 5: Changes in Summer Enrollment: Demographic Characteristics (Age, Sex, County, Race/Ethnicity) Over the Past Five Years
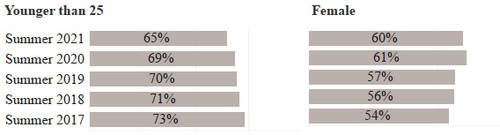
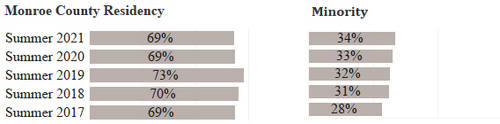
Figure 6 for Summer 2021 Enrollment Highlights
Figure 6: Changes in Summer Enrollment: Academic Characteristics (Matriculation Status, Academic History). In degree/certificate vs. continuing from spring.
What Students Want: Summary of the College-Wide COVID Era Survey
By Mary Ann M. DeMario
In spring 2021, I created a college-wide survey in order to assess current and former students’ experiences pre- and mid-COVID. The purposes were to:
- understand how MCC can help current students
- understand how we can assist stop-outs/drop-outs return to MCC
- prevent the over-surveying of students by combining small surveys from several MCC offices.
I sent the survey to 16,769 students who were enrolled in spring 2020, fall 2020, and/or spring 2021, but omitted students who had graduated or been in Dual Enrollment. I received responses from 1,542 people, which gives us a margin of error of ±3%. This means that the results can be generalized to the larger population of students who were sent the survey. Approximately 81% of the respondents were enrolled at MCC in the spring, while 19% had stopped or dropped out. Two-thirds of the respondents were female, more than two-thirds were Students of Color, nearly nine out of 10 were matriculated, and more than a quarter were Student-Parents.
The results of the survey shed light on the following:
- IR's COVID-Era College-Wide Survey Results: Section I
- What respondents need right now
- Why respondents enrolled at MCC
- Why some students have left while others stayed
- How the pandemic has changed students’ lives
- Generally: IR's COVID-Era College-Wide Survey Results Section II
- Academically: IR's COVID-Era College-Wide Survey Results Section III
- Employment: IR's COVID-Era College-Wide Survey Results Section IV
- IR's COVID-Era College-Wide Survey Results Section V
- Student Services
- Preferred methods of communication
- “Belongingness” at and satisfaction with MCC
- Sub-reports about various MCC offices and groups
- MCC Schools: IR's COVID-Era College-Wide Survey Results Section VII
- Office of Student Life and Leadership Development: IR's COVID-Era College-Wide Survey Results Section VIII
- Advising and Transfer: IR's COVID-Era College-Wide Survey Results Section IX
- Student-Parents: IR's COVID-Era College-Wide Survey Results Section X
- Implications and Recommendations: IR's COVID-Era College-Wide Survey Results Section XI
The full report is available on the MCC Internal Resources page, in the section titled “Surveys.” Summaries of the results are also available in the July and August 2021 issues of the MCC Employee Tribune. The bulleted hyperlinks above take the reader to those public-facing Tribune articles.
Additional Information & Contacts
For more information, you can visit the Institutional Research (IR) website or contact an IR staff member:
- William Dixon, Director, (585) 292-3031
- Elina Belyablya, Assistant Director, (585) 292-3033
- Mary Ann Matta DeMario, Specialist, (585) 292-3032
- Allison Wanek, Clerk, (585) 292-3035
Previous issues of Inside IR are available through our Newsletters webpage.
Location & Contacts
Brighton Campus
Building 11, Room 208
M - F 8:45am - 4:45pm
(585) 292-3035