Spring 2022 Inside IR
Inside This Issue
Where We Are and Where We’re Going
The purpose of this issue of Inside IR is to present data on current enrollment, retention, and persistence rates. As you read through this issue, keep in mind that retention is critical to the future of the College, especially over the next two years.
Fall 2021 Enrollment
By Elina Belyablya
The fall census shows a 14.2% decline in headcount compared to fall 2020. That means we had approximately 1,400 fewer students enrolled this fall than last fall. The decline is the result of lower overall enrollment in general in recent years, lower enrollment of new students and a decline in retention. The first and third reasons explain 63.9% of the overall decline in headcount. Although we cannot change the past, it is critical that we support currently enrolled students and recruit new ones.
Our fall 2021 enrollment at census positioned us as the fourth largest among SUNY community colleges, nearly tying us with Westchester. (See Figure 1.) As the fall semester ended and “end of term” reporting took place, our standing changed. MCC moved to the number two position among SUNY community colleges, second only to Suffolk. (See Figure 2.) This was due to the fact that PSTF and Dual Enrollment students were included in the end of term (but not census) reporting.
MCC fall Dual Enrollment numbers have been growing over time, and fall 2021 was the highest in the past three fall semesters. While not all Dual students come to MCC after high school and the revenue from the program is not as high as “regular” MCC enrollment, there is a clear impact from the program. Its large size is an important element of MCC and SUNY-wide recruitment. Dual Enrollment gains this fall semester resulted in MCC meeting its fall budget goal.
Figure 1 for Fall 2022 Enrollment
Figure 1: Fall 2021 Enrollment at Census: All SUNY Community Colleges*
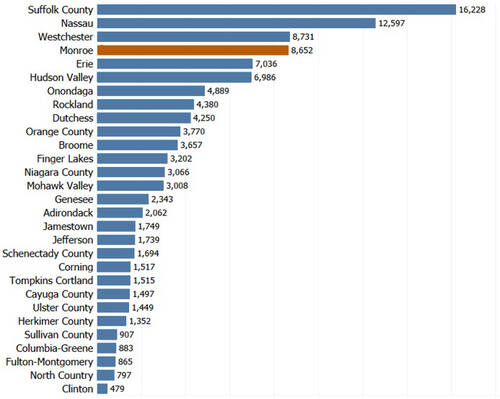
*Excludes any high school enrollment
Figure 2 for Fall 2022 Enrollment
Figure 2: Fall 2021 Enrollment at End of Term: All SUNY Community Colleges*
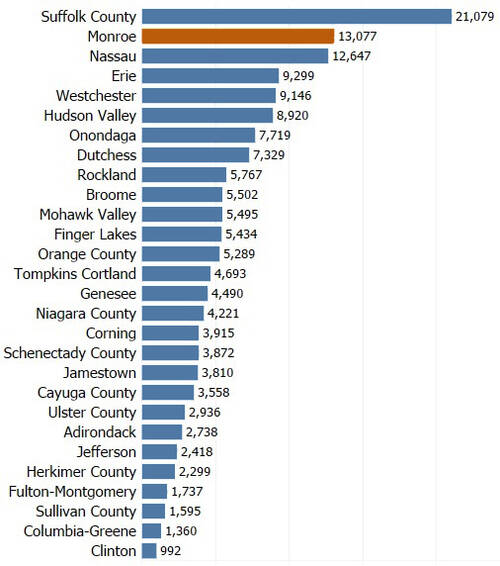
*Includes Dual Enrollment students (3,598 at MCC)
Fall 2021 To Spring 2022 Persistence
By Elina Belyablya
As illustrated in Table 1, overall persistence from fall 2021 to spring 2022 was 69.3%. It was an improvement of 0.5 percentage points over last year but still below the years prior to that.
Figure 3 shows that the persistence of First-Time students moved half way from the mid-pandemic low of 67.3% in fall 2020 towards the pre-pandemic high of 77.2%. Transfer and Continuing students’ retention did not change, statistically speaking. The only group whose persistence rate remained on a downward trajectory was Returning students (that is, students who returned to MCC in the fall after several semesters away).
Gains in persistence were largely due to an increase in persistence among males with the exception of Returning male Students of Color as well as White females. These are presented in Table 2.
In fall 2020 and fall 2021, many students received special financial support from the federal government called Higher Education Emergency Relief Fund (HEERF). Its purpose was to serve additional financial support to students and ensure learning continued during the COVID-19 pandemic.
Figure 4 summarizes students’ persistence rates as they relate to HEERF and MCC educational trajectory status. Each bar represents’ persistence from fall to spring. For example, the blue “Fall 2021” bars represent persistence from fall 2021 to spring 2022.
One takeaway is that, with exception of first-time students, the persistence rates of HEERF recipients were higher in general than students who did not receive HEERF. For example, among Returning students, the ones who received HEERF in fall 2021 had a 58.7% persistence rate to this semester while the ones who didn’t receive HEERF had a 44.0% persistence rate.
What is interesting is that fall 2020 to spring 2021 persistence under HEERF was higher than fall 2021 to spring 2022 persistence for the majority of groups. This could be linked to differences in HEERF administration between those years, as well as external changes such as growing employment opportunities.
Figure 3 for Fall 2021 To Spring 2022 Persistence
Figure 3: Fall to Spring Persistence by Educational Status
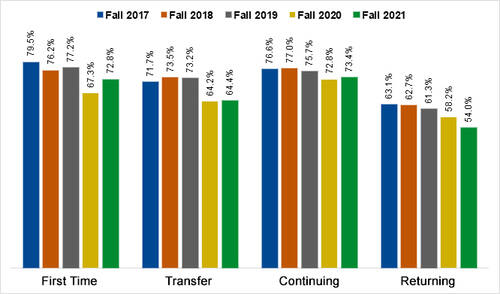
Figure 4 for Fall 2021 To Spring 2022 Persistence
Figure 4: Fall to Spring Persistence Rates as Related to HEERF
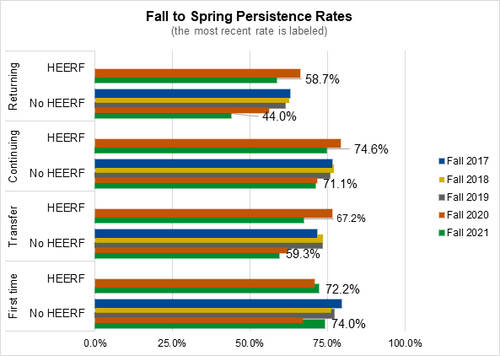
Table 1 for Fall 2021 To Spring 2022 Persistence
| Starting Fall Term | Persistence (to Spring) Rate |
|---|---|
| 2015 | 76.0% |
| 2016 | 75.4% |
| 2017 | 75.1% |
| 2018 | 74.5% |
| 2019 | 73.8% |
| 2020 | 68.8% |
| 2021 | 69.3% |
Table 2 for Fall 2021 To Spring 2022 Persistence
| Race/Ethnicity Group | Gender | Fall 2017 | Fall 2018 | Fall 2019 | Fall 2020 | Fall 2021 | 1 Year Change |
|---|---|---|---|---|---|---|---|
| Students of Color | Male | 74.50% | 73.30% | 72.00% | 56.50% | 68.50% | 12.00% |
| Students of Color | Female | 79.60% | 75.00% | 77.60% | 56.50% | 71.20% | 7.30% |
| White | Male | 79.60% | 75.30% | 72.00% | 69.80% | 76.50% | 6.70% |
| White | Female | 83.30% | 80.50% | 79.60% | 75.40% | 73.00% | -2.50% |
| Race/Ethnicity Group | Gender | Fall 2017 | Fall 2018 | Fall 2019 | Fall 2020 | Fall 2021 | 1 Year Change |
|---|---|---|---|---|---|---|---|
| Students of Color | Male | 68.30% | 78.70% | 72.90% | 59.20% | 57.20% | 2.10% |
| Students of Color | Female | 68.70% | 69.80% | 72.10% | 61.90% | 57.20% | -4.70% |
| White | Male | 69.00% | 74.10% | 69.20% | 66.30% | 68.90% | 2.60% |
| White | Female | 77.60% | 73.00% | 77.30% | 67.00% | 67.40% | 0.40% |
| Race/Ethnicity Group | Gender | Fall 2017 | Fall 2018 | Fall 2019 | Fall 2020 | Fall 2021 | 1 Year Change |
|---|---|---|---|---|---|---|---|
| Students of Color | Male | 73.10% | 72.20% | 73.30% | 69.40% | 67.80% | -1.60% |
| Students of Color | Female | 75.50% | 75.00% | 70.40% | 68.30% | 71.60% | 3.30% |
| White | Male | 76.70% | 80.80% | 79.90% | 74.70% | 76.20% | 1.60% |
| White | Female | 79.00% | 77.90% | 77.80% | 76.80% | 75.10% | -1.70% |
| Race/Ethnicity Group | Gender | Fall 2017 | Fall 2018 | Fall 2019 | Fall 2020 | Fall 2021 | 1 Year Change |
|---|---|---|---|---|---|---|---|
| Students of Color | Male | 55.90% | 53.00% | 55.60% | 51.30% | 45.60% | -5.70% |
| Students of Color | Female | 60.80% | 56.80% | 58.50% | 53.60% | 52.40% | -1.10% |
| White | Male | 65.30% | 65.10% | 64.80% | 54.20% | 57.10% | 2.90% |
| White | Female | 68.70% | 72.70% | 65.70% | 68.10% | 58.50% | -9.70% |
Fall to Fall Retention
By William Dixon
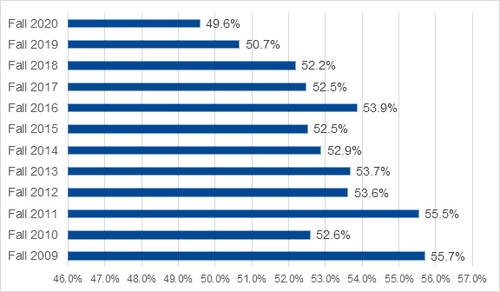
As the IR Office has relayed many times, MCC student headcount has been dropping since fall 2009. This drop is being driven by a number of factors. First, there are fewer new (incoming) students enrolling at MCC. This is shown throughout the Internal pages of the IR web site, for example, in the “Enrollment” and “Academics” sections. Second, students’ retention rates have dropped since fall 2009, as illustrated in Figure 5. While that drop doesn’t influence the College academic reputation, it causes a drop in graduation rates and is a significant obstacle for enrollment projections. This is because those projections need two inputs: the number of new students who enroll at MCC, and the number of continuing students who remain here.
Figure 5 for Fall to Fall Retention
Figure 5: Fall to Fall Retention Rates of Matriculated Students
Fall to Fall Retention by Course Delivery Method
By William Dixon
You may have been in a meeting recently and heard that students are not doing as well in courses since the pandemic started. This article focuses on that issue and examines course success rates since fall 2019 in courses delivered in face-to-face, online (asynchronous), and remote (synchronous) formats.
Figure 6 shows that online courses have lower success rates that face-to-face courses, both before and during the pandemic. Historically, MCC has seen a 10% to 13% lower success rate for students in online sections. Overall success in online courses has remained relatively stable over this time period, but the increase in online sections led to an increased number of students who are unsuccessful. Future research will focus on why this discrepancy occurs and what resources can be used to increase online student success.
Figure 6 for Fall to Fall Retention by Course Delivery Method
Figure 6: Fall to Fall Retention Rates of Matriculated Students by Course Delivery Method
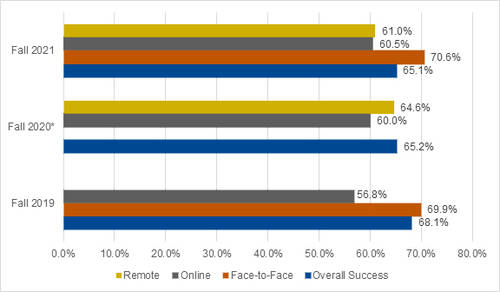
* Fall 2020 face-to-face success rates are omitted because there were a limited number of course sections. The sections that were held face-to-face had a success rate of almost 90%.
Additional Information & Contacts
For more information, you can visit the Institutional Research (IR) website or contact an IR staff member:
- William Dixon, Director, (585) 292-3031
- Elina Belyablya, Assistant Director, (585) 292-3033
- Mary Ann Matta DeMario, Specialist, (585) 292-3032
- Allison Wanek, Clerk, (585) 292-3035
Previous issues of Inside IR are available through our Newsletters webpage.
Location & Contacts
Brighton Campus
Building 11, Room 208
M - F 8:45am - 4:45pm
(585) 292-3035