Spring 2020 Inside IR
Inside This Issue
MCC Graduation Rates Update
By Elina Belyablya
The most recent MCC graduation rate refers to graduation within 3 years with an associate degree or within 1 ½ years for a certificate for students who entered MCC as first time full time in fall 2016. There were 2,638 students in the cohort. The overall graduation rate was 24.7%.
The most recent MCC graduation rate of 24.7% reached its second highest level this decade. It was comparable to the graduation rate for fall 2008 entering students.
Figure 1 shows that White students drove the increase, reaching an all-time high graduation rate of 31.8%. They represented the largest group among the fall 2016 entering cohort. Other race/ethnicity groups did not show an improvement compared to prior cohorts. Both male and female groups had an increase in graduation rates (23.3% and 26.1%,respectively) compared to a prior cohort.
As shown in Figure 2, the math preparation of the cohort was the strongest correlate of graduation. Specifically, the 56.5% of the cohort with the highest level of math placement graduated on time, while only 6.1% of students with the lowest placement (Level 1) did so. The successes and failures of the majority of incoming fall 2016 students who placed in mathematics Levels one through four (54% of all students) drove completion rates.
Figure 1 For MCC Graduation Rates Update
Figure 1: Graduation Rate of First Time, Full-Time Fall 2016 Students by Race/Ethnicity

Figure 2 For MCC Graduation Rates Update
Figure 2: Graduation Rate of First Time, Full-Time Fall 2016 Students by Math Placement

Downtown Campus Enrollment, FTE, and Demographics
By Clint Cantwell
The total number of students taking any classes at the Downtown campus decreased 15.6% from 2,320 in fall 2015 to 1,958 in fall 2019. The number of students taking all their classes Downtown decreased 20.5% from 1,161 in fall 2015 to 923 in fall 2019. As a result, the total FTEs generated by the Downtown campus decreased 18.1% from 656.9 in fall 2015 to 538.2 in fall 2019. The decline in enrollment and FTE at the Downtown Campus is in line with the general decline at the College. Figure 3 illustrates this data.
The racial distribution at the Downtown campus remained relatively stable from fall 2015 to fall 2019.
The racial distribution at the Downtown campus remained relatively stable from fall 2015 to fall 2019. There were some changes among the individual racial groups, but the percentage of students of color did not significantly change. Table 1 provides the specifics.
From fall 2015 to fall 2019 there was a 3% change in the gender distribution of students Downtown. There was a decrease in the percentage of male students and an increase in the percentage of female students. See Figure 4 for this information
Figure 3 For Downtown Campus Enrollment, FTE, and Demographics
Figure 3: Downtown Campus Enrollment and FTE (Fall 2015 to Fall 2019)

Figure 4 For Downtown Campus Enrollment, FTE, and Demographics
There was a decrease in the percentage of male students and an increase in the percentage of female students.
Figure 4: Downtown Campus Gender Distribution (Fall 2015 to Fall 2019)

Table 1 For Downtown Campus Enrollment, FTE, and Demographics
The overall percentage of students of color remained relatively stable from fall 2015 to fall 2019.
| Race/Ethnicity | 2015 | 2019 |
|---|---|---|
| White | 33% | 32% |
| Black | 46% | 41% |
| Hispanic | 14% | 17% |
| Asian | 02% | 03% |
| Native American | 00% | 00% |
| Non-resident Alien | 04% | 05% |
| Multiracial | 00% | 00% |
| Pacific Islander | 00% | 00% |
| Total Minority | 67% | 66% |
Supporting Student-Parents
By Mary Ann M. DeMario
The terms “Student-Parents” and “Single Parents” are often used synonymously but they don’t mean the same thing.
The term “Student-Parents” is relatively new, coined only in the last two or three years. Student-Parents include Single Mom Learners, married moms, single dads, and married dads. Note that the terms “Student-Parents” and “Single Parents” are often used synonymously but they don’t mean the same thing. Figure 5 shows the types of Student-Parents enrolled at MCC.
The Richard M. Guon Child Care Center at the Brighton campus has supported Student-Parents since the early 1990s. It is a nationally recognized, scientifically proven model of what colleges can do to increase Student-Parents’ success rates. The Center has been recognized as an essential service for parents at MCC and in the surrounding community during the COVID 2019 pandemic. It continues to provide care for children four months through five years old, some of whom have parents working in essential fields such as health care and food service.
MCC has spent the past one-and-a-half years working to make the College family-friendly in other ways. A family-friendly study lounge was opened on each campus in February 2020. Drop-in child care was implemented at the Downtown Campus in March 2020. When face-to-face classes resume after the pandemic and data is available on Student-Parents’ use of those facilities, IR can assess their effectiveness and MCC can decide whether they should be scaled up.
Success Rate:
Single Mom Learners’ rates of MCC graduation and/or transfer to a four-year college
The Single Moms Success Design Challenge is aimed at increasing Single Mom Learners’ success rates by 30%. The Challenge is a six-year long research project in which MCC and the three other colleges who received the Challenge will:
- learn more about Single Mom Learners’ experiences and barriers to success
- brainstorm possible solutions to increase Single Mom Learners’ success rates
- get feedback on those solutions
- pilot test potential solutions
- revise and retest potential solutions over the next five years
- implement the successful solution(s) at scale in 2024.
By supporting Student-Parents, we benefit multiple generations of people, the College, and the community. Doing so is inherent to MCC’s Vision, Mission, and Core Values.
The three other colleges that were awarded the Design Challenge are Central New Mexico Community College, Delgado Community College (New Orleans), and Ivy Tech (the statewide community college system in Indiana).
Figure 5 For Supporting Student Student-Parents
Figure 5: Types of MCC Student-Parents (2019-2020)
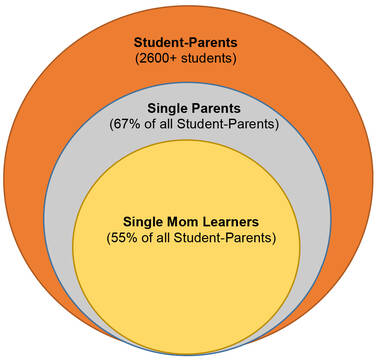
What isn’t shown in the figure is that there are many more students – at MCC and other institutions – who are not parents but nonetheless are responsible for taking care of younger siblings or other related and unrelated children.
Definitions of the sections of the diagram in Figure 5:
- Student-Parents
All parents with children under age 18. Student-Parents make up 22% of the MCC student population†. - Single Parents
Student-Parents who are unmarried. They encompass both single dads and Single Mom Learners. - Single Mom Learners
Single Parents who are female. More than half of all MCC Student-Parents are Single Mom Learners.
†Among the students whose parental status is known.
Additional Information & Contacts
For more information, you can visit the Institutional Research (IR) website or contact an IR staff member:
- William Dixon, Director, (585) 292-3031
- Elina Belyablya, Assistant Director, (585) 292-3033
- Mary Ann Matta DeMario, Specialist, (585) 292-3032
- Allison Wanek, Clerk, (585) 292-3035
Previous issues of Inside IR are available through our Newsletters webpage.
Location & Contacts
Brighton Campus
Building 11, Room 208
M - F 8:45am - 4:45pm
(585) 292-3035